
I am an ambassador for Polar and BestBikeSplits.com mentioned in this article
While being good at following numbers during a session, I very rarely do post training or racing analysis. Going thru the race combining the pure numbers and an honest view of your performance is key to improve performance in the next race. This is my analysis of Norseman.
Swim
Unfortunately, I do not have good historical data regarding my swim HR in races or training. With the H10 HR sensor (chest strap used during racing) and the new OH1 (optical used during pool swimming) provided by my sponsor Polar I now get good measuring and has done it the last 6 months.
My subjective feeling of the swim was that I started with maximal sustainable effort and a rather quick stroke rate, which is more effective when swimming close to each other in a pack. Then I settled into a slower stroke and less effort until I “got my shit together” and made a surge to get the feet 10-15 meters ahead. Then I settled down behind the legs for a while before I tried to up the pace and swim in front. I ended up swimming in front but eased down the intensity in order to not burn all the matches in the swim. During the swim, I gave myself a lot of negative talks that I was going too easy and was certain that my swim was slow.


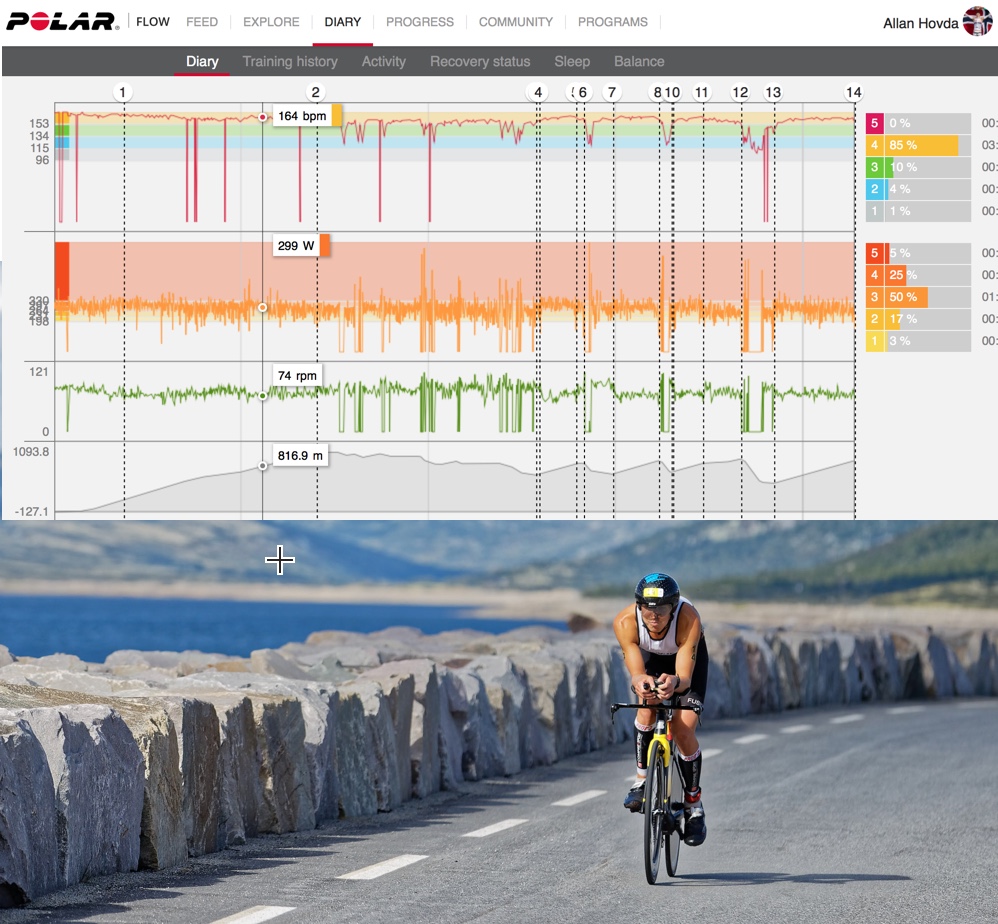
The HR data confirms my initial subject feeling and you can see how I start with a fast stroke and a relatively high but not over the top HR. Then you can see the surge I did in order to get on the feet, and another when I increased the pace and swam of in front. What the data does not confirm was my subjective feeling of going too easy and swimming slower than I could. Most likely I could have gone a few seconds faster pushing the limit towards the end, but it would at most have given me 30 sec and forced me to push 173+ BPM instead of 163 BPM which I did. That is a huge difference in the perceived effort!
My plan of being on the feet to the female winner and former swimmer Metter Pettersen Moe I would have gotten out of the water 42 seconds earlier. When that did not happen (due to the “torpedo” who got between us at start described in the race report) I believe that the swim I did was probably the best I could execute in my current swim form.
Bike
My coach Carson Christen wrote a blog post about the watts that produced the best bike split in Norseman that can be read in this blog post.
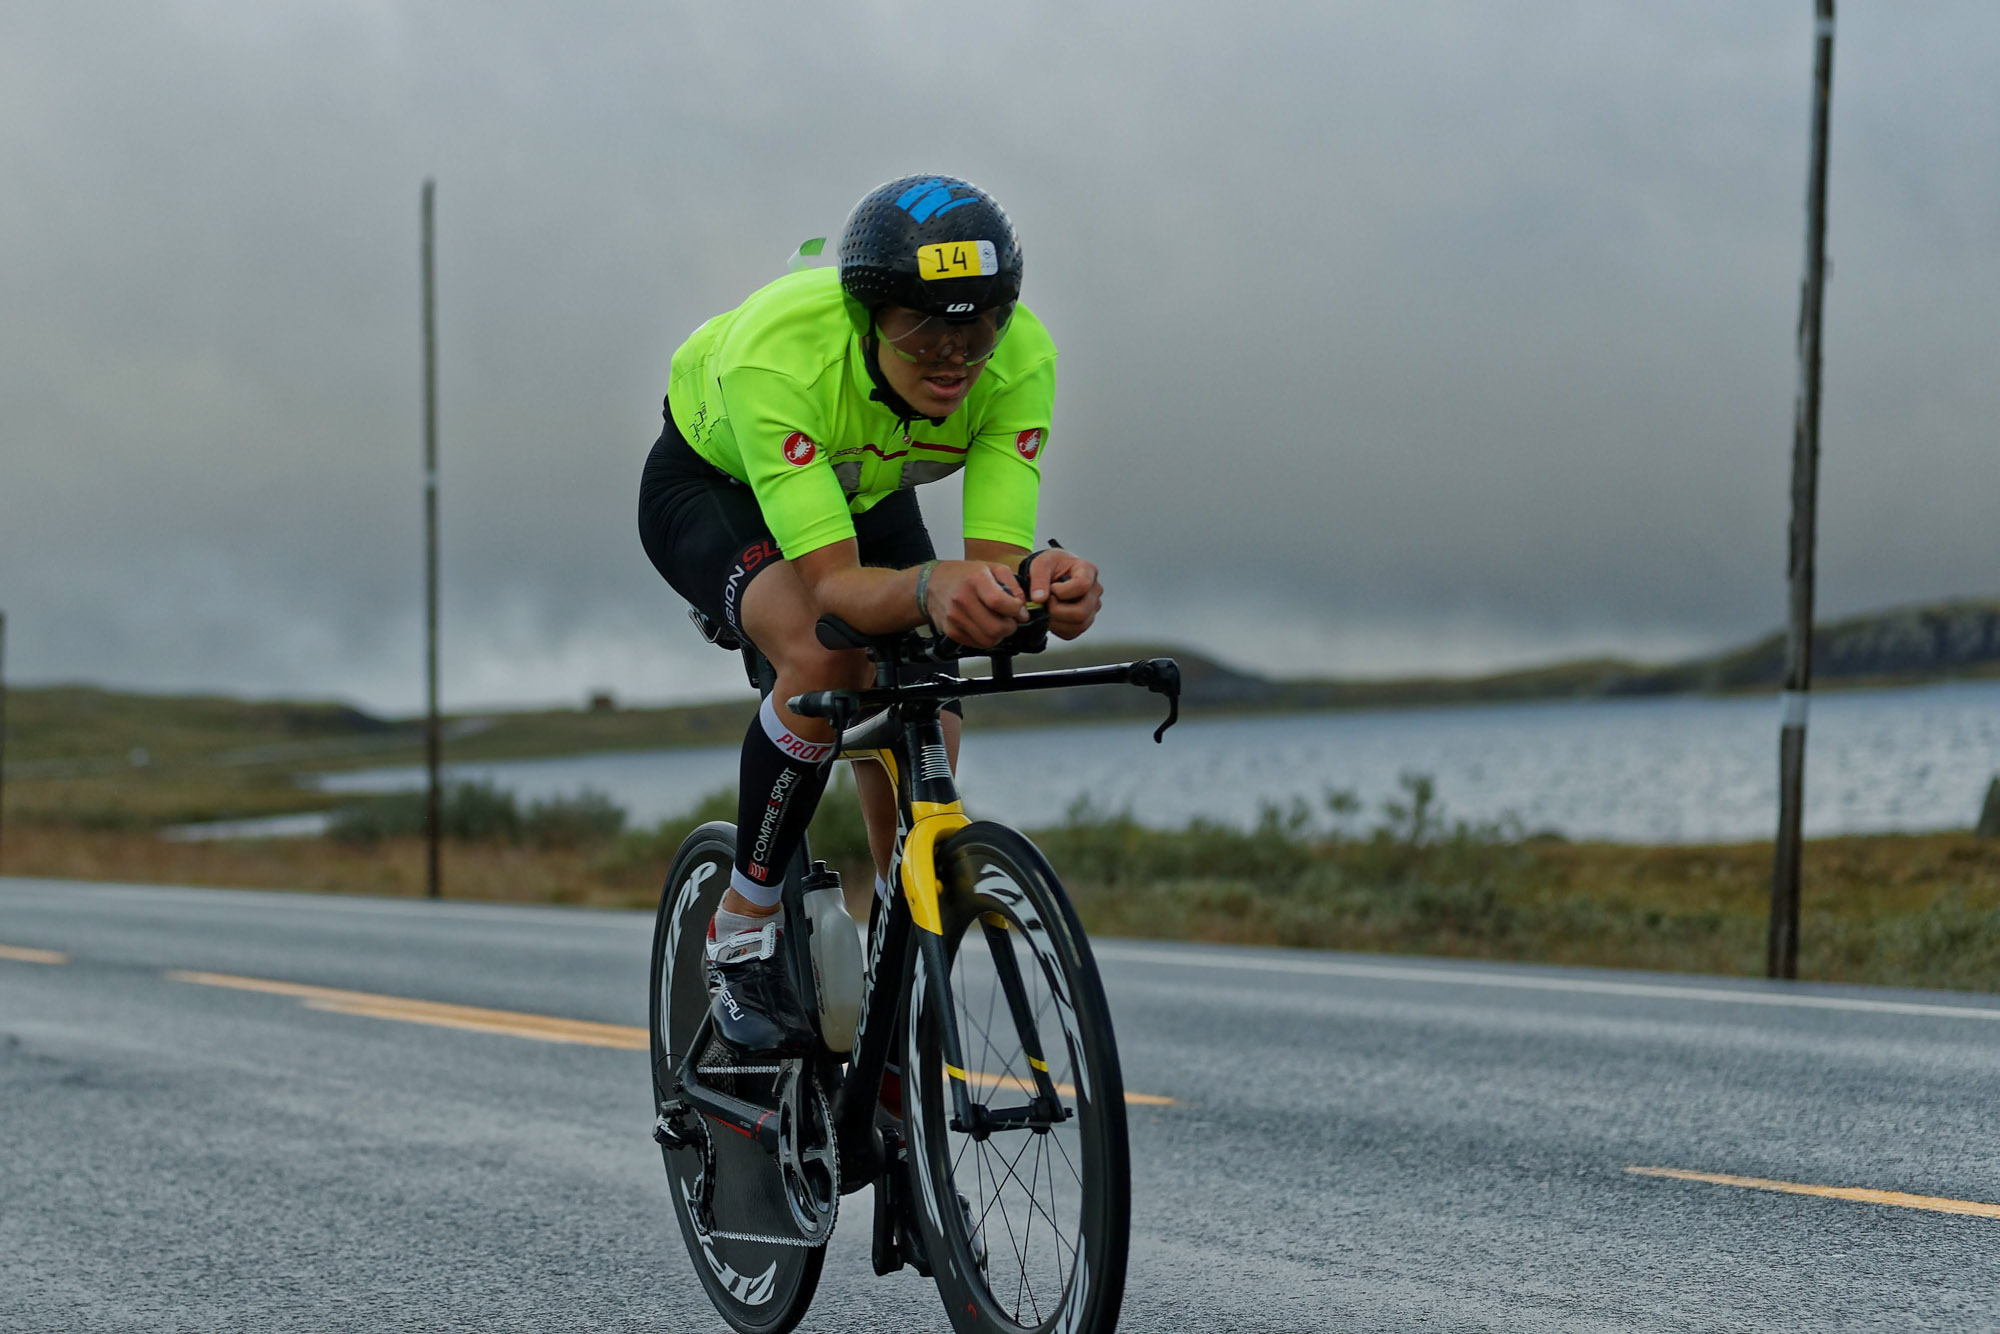


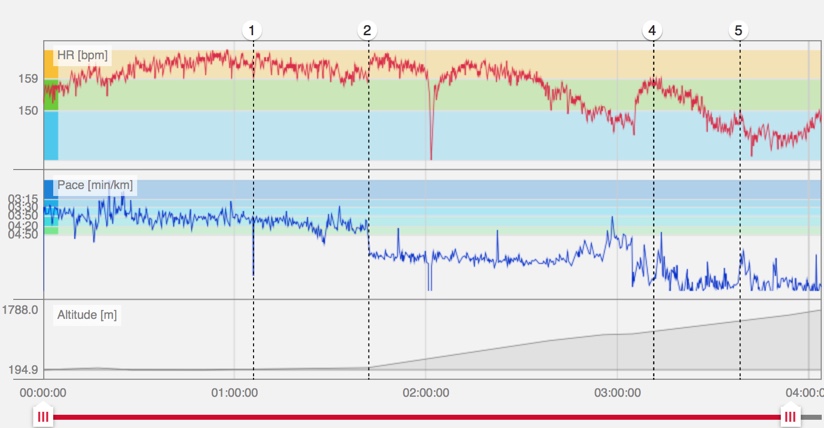
I have worked with the software analysis program BestBikeSplits who calculates where how I get the best use of my watts. Earlier I was in the belief that the more even watts you push the better, but I was not entirely correct. In a flat course with no wind that is optimal. In hilly courses, you will be better of pushing harder in the hills and less on the flats and downhill. If headwind you should also push harder and back of in tailwind. The estimated watts for Norseman given by BBS was nearly hard to believe. Go hard up to Dyranut averaging 285w (Normalized), then just chill out across the Hardangervidda with 225w before going at 300w at each of the following hills. I started out slightly harder than BBP wanted me to the first 10 km flat section before the long climb started, but then settled into the correct intensity and averaged 295w the first 1,5 hours up to Dyranut. You can see from my HR data that it is rather high after the swim as usual but then settles into the correct intensity. For that reason, I never use HR data early on the bike to adjust my intensity.


Since Lars Christian passed me with a blast at Dyranut I held a higher watt across the Hardangervidda in order to keep a visual on him but was very clear that I should try to keep up if I had to increase more than 20-30 watts above estimated goal to do so. I ended up with 243w and 153 BPM, 11 PBM lower than the first climb. I thought the plan from BBS sounded a bit weird, but know that the probability that the number crushers and passionate engineers there know this better than myself is 99,9 %. For that reason, I trusted their plan. At least have the ability to not trust my instinct and rather go for the reasonable solution and listen to the experts.
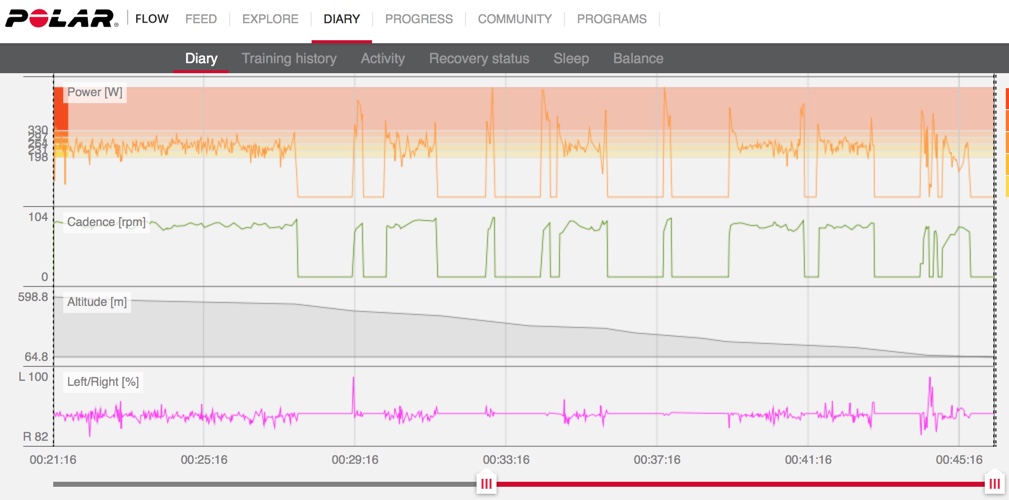
When we hit the first climb after Geilo I immediately started working harder. 303w in 11:48 and an HR of 162 BPM. Right on target. 287w for 14:42 with 163 BPM on the next. 284w for 9:35 and 160 BPM the one after that before finishing off at 277w for 25:51 and 160 BPM on the last climb up Imingfjell. That was slightly below target, and I have no other reason for that than I felt it was the correct pace. I did not want to force it anymore. I did have a 1 hour and 5 minutes at 20 watts above target across the Hardangervidda and going slower in the hills was maybe the price I had to pay in order have fresh legs for the run.
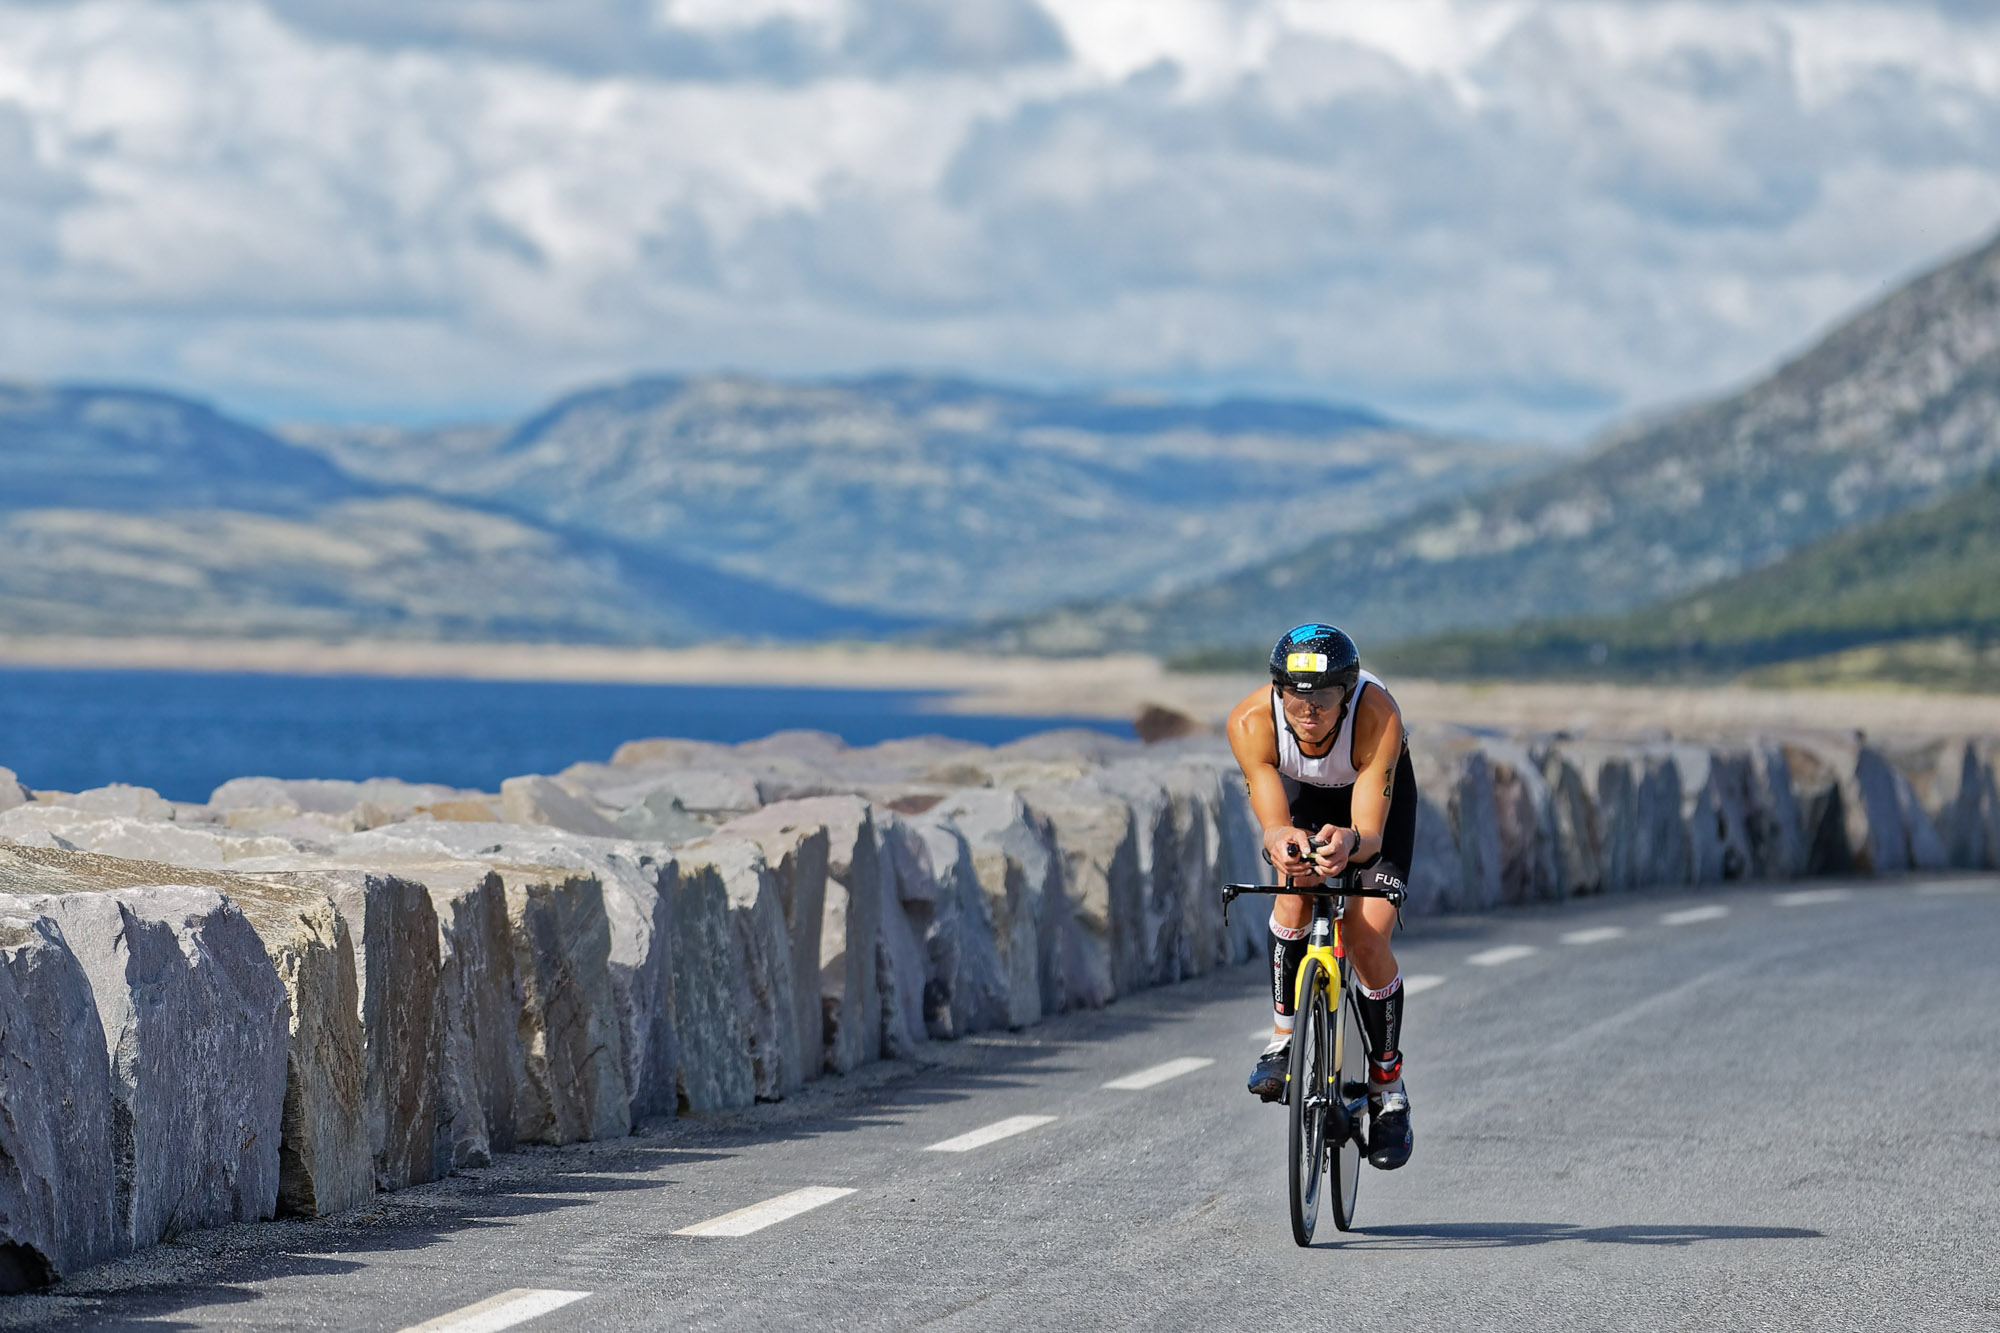
The last 30 km to Austbyde was rather funny regarding watts. It is first a steep downhill followed by 20 km slightly downhill. We had a tailwind and pedalled hard, then get down on the frame. For that reason, I had 156 watts on average on that stretch with an average speed of 55,3 km/h. You could also see my HR drops to 135 BPM. Never before have I had an easier ride the last part and was perfectly set up for a great run. That I had the fastest bike split of the day and was only 14 sec from the bike course record tells me that I had used my watts wisely and that the weather conditions were record fast.
Run
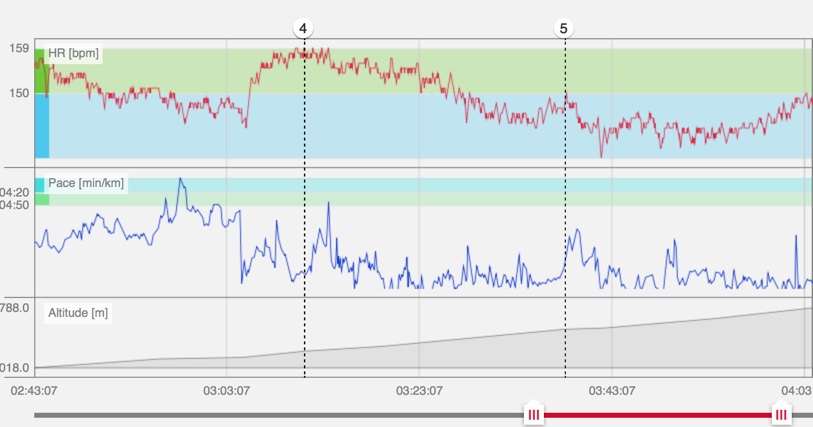
On the run, I felt great. Maybe the best I ever felt. The first 2 km goes slightly downhill and I was flying. 3:41 and 3:42min/km. My HR was lower than usual and only 155-ish, due to an easy last part of the bike. Then the pace settled into a more stable 3:50-4:00 min/km pace with an HR of 162-164 BPM, which is more normal. Notice that the flat part of the run in Norseman is actually not flat all the way, hence the relative big variation in min/km. The first 10km I did in 38 min and I felt I was flying. I kept my pace good until 20km were I had my first 1 km flat at 4:11 min/km pace. Then I had two very slow km at 4:28 and 4:27, which was mainly due to the small elevation in the course. Still, it was a clear sign that, for the first time in the race, I started to suffer. After getting into the hills my pace naturally fell like a rock since they are so steep. My HR, however, did not fell, but was steady and high, which indicated that I was working as hard as before. You can see a major drop caused by me peeing for 54 seconds, which is a new PR in the longest peeing brake. You can see that nearing the 32,5 km checkpoint my HR starts to decline together with my pace. At this stage, my last split told me I had a 21,5 min lead. Getting that information was both a relief and a curse. I knew that I could no lose that much in the last stage and that the victory was mine. It did, however, sabotage my motivation to keep on pushing. It also changed my mindset from destroying the other on the run to just securing the victory. It turned me into the coward I prior to the race was determined to not become. I was going to run as hard as I could until I blacked out. I was not even close and the HR confirms it by dropping from Zone 4 to Zone 2.


I dislike myself for doing this, but I cannot help it. I am feeling slightly dissatisfied with the race. The outcome, winning, was obviously what I aimed for. My internal goal was not winning as this is too abstract to work against. I was going to swim a maximum two minutes slower than Lars Christian, ride with 260 watts on average and run similar to my record run in 2015. Doing that would av lower the course record too below 9:45. I was not able to finish the run strong or push myself to a depth I have never been to before. I was in no doubt tired when crossing the line, but far from completely depleted, the state I wanted to go. The depth I wanted to dig into.
The data confirms my feeling, and I do not have a clear idea on why I was not able to push harder. Was it being lack of motivation or lack of physical power or both? Could I physically have gone harder if I had to? I honestly don’t know. What I do know is what to work on and hopefully, we will get a better answer in Norseman next year.

Gratulerer med seieren i Norseman, og takk for at du deler dine data og kunnskap på bloggen! Jeg har lest mye av det du har skrevet – det er til stor inspirasjon!
Spørsmål:
Er pulssonene inndelt etter olympiatoppens 5 soner (eller en annen skala)?
Hvor høy puls (prosent av makspuls eller terskel) anbefaler du å ligge på i konkurranser (f.eks olympisk vs ironman)?
Hei John Daniel,
Det er min trener, Carson Christen som har beregnet min HR soner etter en klassisk 20 min makstest på sykkel og løp. De er relativt like sonene til Olympiatoppen basert på makspuls. Jeg tror at mitt sone 3/4-skille er noe for lavt, men generelt ligger jeg veldig høyt i puls. Anbefaler «ingenting» med tanke på puls for det er så ekstremt individuelt. Anbefaler i mye større grad å kjøre på watt på sykkel og fart på løp (justert for varme og «hardhet» på løypa) og kombinere det med følelsen. Har startet med høy puls på løp og møtte veggen gradvis, og har startet med høy puls på løp og holdt helt inn. Pulsen på sykkel og løp virket lik, men jeg kjente at det var mye tøffere den gangen jeg møtte veggen gradvis. Kanskje like tøff belastning for hjertet men musklene var ikke like friske.
Takk for (raskt) svar og input!